Methodology
5.Grading of corporate performance
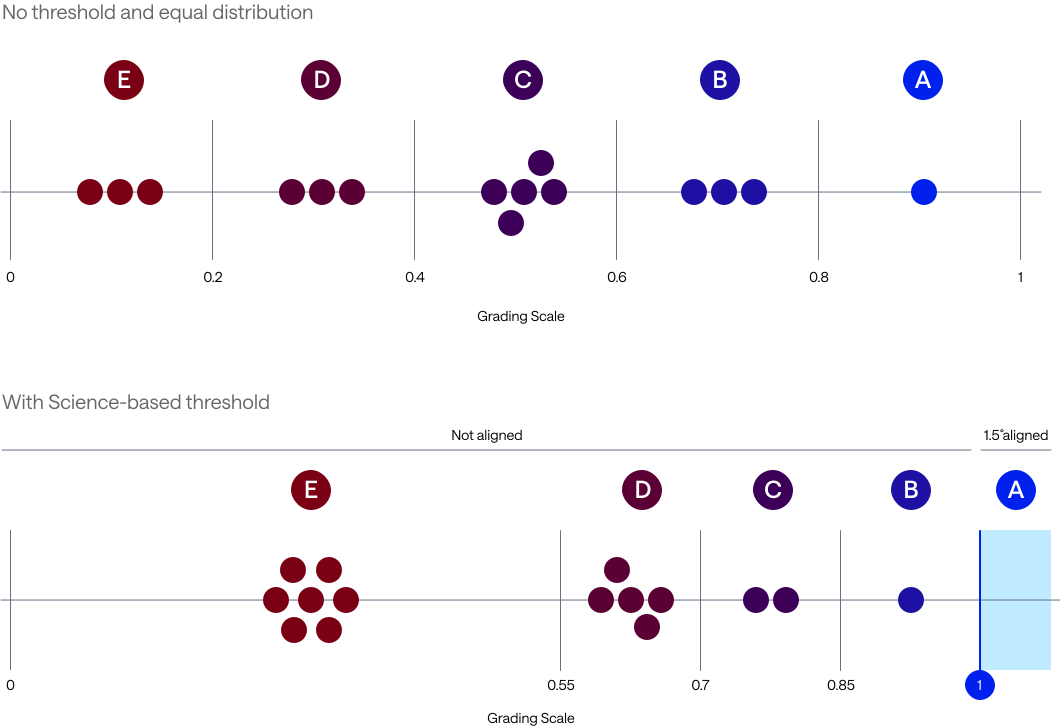
The platform provides FIs with decision-leading information on corporate transition alignment by benchmarking their performance against a credible transition pathway. This is achieved by generating a graded assessment of company performance in each of the seven climate-oriented metrics outlined above. The grading system places companies on an A to E scale, where A represents alignment with a science-aligned transition pathway, and B to E represent varying degrees of deviation from this path. A science-aligned pathway is one that aims to limit the global temperature rise to 1.5°C with no or limited overshoot.
By anchoring the 'A' grade to a threshold aligned with scientific standards, our grading approach stands out from conventional ESG scoring systems. While many ESG frameworks assign top grades based on relative performance within a group, our system ensures that only companies truly aligned with a credible, science-based transition pathway receive an 'A'. The distance between the remaining grade boundaries (B to E) is determined by fixed intervals based on the company’s relative deviation from the science-based threshold. This grading distribution ensures that the distribution of grades among companies is consistent and not skewed by outliers, promoting accuracy and fairness.
5.Harmonization of underlying datasets
All datasets presented in the platform evaluate companies against a science-aligned pathway using different metrics and scoring. To allow for comparability across sources and aggregation to a final score, the platform harmonizes the different source datasets on a single scale. This standardization involves a normalization process, whereby a benchmark value of 1 represents what is considered science-aligned according to each source dataset. Consequently, companies scoring 1 or higher in the overall score are considered aligned and are awarded an ‘A’. The remaining grade boundaries are set at intervals of (0-0.55] for E, (0.56-0.7] for D, (0.71-0.85] for C and (0.86-0.99] for B. This method maintains the integrity of each data provider's expert judgement regarding what represents alignment with the relevant transition scenario.
Apart from normalization to a universal scale, Arc applies no transformations or changes to the data of the underlying data providers. This retains the important link back to the technical calls made by experts within each data provider. The underlying data provided by the partner organisations is also available on the platform. This maintains the link back to the source datasets and ensures that users have the option of reverting to the original scoring systems used by the partners if desired (in particular, if they are accessing information via the data exchange or API).
5.Aggregation and weighting of metrics
A common scoring system also allows us to provide an overall company grade. Figure 2 illustrates how the five metrics are aggregated to a single company grade.
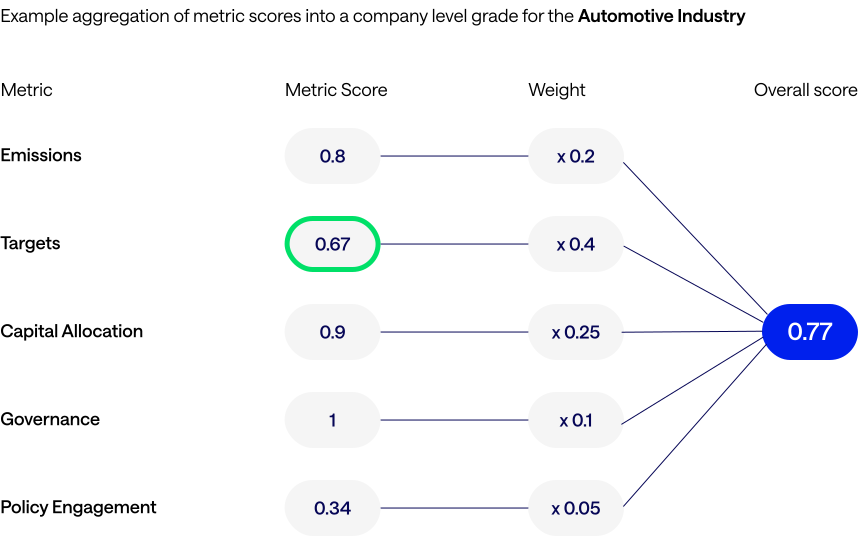
Default metric weightings within TransitionArc are derived from the ACT Methodology, which is sector specific. All ACT indicators for each sector were classified as relevant (or not) to one of the chosen metrics (as shown in Figure 3).
Indicators assessed as not relevant may be reintegrated in future if additional metrics are needed based on ongoing assessments and discussions with partners. The weightings of the indicators assessed as relevant to the seven metrics were aggregated to the metric level and reweighted following the exclusion of those deemed not applicable (Figure 3). These calculated metric weightings were then rounded to the nearest 5% to avoid providing an illusion of false precision.
Where the rounded weights did not add up to 100% due to the rounding process, the metric for which the rounding process made the largest difference was adjusted to make up the gap. The resultant metric weightings are shown in Table 5.
| Module | ACT Methodology Indicator name | Indicator or weight |
|---|---|---|
| Targets | 1.1 Alignment of Scope 1+2 emissions reduction targets 1.2 Alignment of Scope 1+2+3 emissions reduction targets 1.3 Time horizon of targets 1.4 Historic Target Ambition and Company Performance | 4% 8% 2% 1% |
| Material Investment | 2.1 Trend in past Scope 1+2 emissions intensity 2.2 Emissions lock-in 2.3 Trend in future scope 1+2 emissions intensity 2.4 Share of unsanctioned projects with carbon budget 2.5 Low carbon and mitigation technologies CAPEX share 2.6 Carbon removal technologies (CDR) and carbon capture, use and storage technologies (CCS, CCUS) CAPEX share | 2% 3% 3% 2% 3% 2% |
| Intangible Investment | 3.1 Share of R&D in low carbon and mitigation technologies 3.2 Share of R&D in carbon removal technologies (CCS, CCUS, CDR) | 4% 4% |
| Sold Product Performance | 4.1 Trend in past Scope 1+2+3 emissions intensity 4.2 Trend in future Scope 1+2+3 emissions intensity 4.3 Trend in future low carbon products share 4.4 Energy efficiency services share | 5% 8% 5% 5% |
| Management | 5.1 Oversight of climate change issues 5.2 Climate change oversight capability 2% 5.3 Low carbon transition plan 3% 5.4 Climate change management incentives 1% 5.5 Climate change scenario testing 2% | 2% 2% 3% 1% 2% |
| Supplier | 6.1 Strategy to influence suppliers to reduce their GHG emissions 6.2 Activities to influence suppliers | 2% 2% |
| Client | 7.1 Strategy to influence client behavior to reduce their GHG emissions 7.2 Activities to influence client behavior to reduce their GHG emissions | 5% 5% |
| Policy Engagement | 8.1 Company policy on engagement with trade associations 8.2 Trade associations supported do not have climate-negative activities or positions 8.3 Position on significant climate policies | 1% 2% 2% |
| Business Model | 9.1 Business activities that drive the energy mix to low carbon 9.2 Business activities that contribute to the reduction of energy demand 9.3 Business activities that develop CCS, CCUS, and negative emissions technologies | 4% 3% 3% |
| Module | ACT Methodology Indicator name | Indicator or weight |
|---|---|---|
| Targets | 1.1 Alignment of Scope 1+2 emissions reduction targets 1.2 Alignment of Scope 1+2+3 emissions reduction targets 1.3 Time horizon of targets | 5% 11% 3% |
| 1.4 Historic Target Ambition and Company Performance | 1% | |
| Material Investment | 2.1 Trend in past Scope 1+2 emissions intensity 2.2 Emissions lock-in | 3% 4% |
| 2.3 Trend in future scope 1+2 emissions intensity | 4% | |
2.4 Share of unsanctioned projects with carbon budget 2.5 Low carbon and mitigation technologies CapEx share 2.6 Carbon removal technologies (CDR) and carbon capture, use and storage technologies (CCS, CCUS) CapEx share | 3% 4% 3%
| |
| Intangible Investment | 3.1 Share of R&D in Low carbon and mitigation technologies 3.2 Share of R&D in Carbon removal technologies (CCS, CCUS, CDR) | 5% 5% |
| Sold Product Performance | 4.1 Trend in past Scope 1+2+3 emissions intensity | 7% |
| 4.2 Trend in future Scope 1+2+3 emissions intensity | 11% | |
| 4.3 Trend in future low carbon products share | 7% | |
| 4.4 Energy efficiency services share | 7% | |
| Management | 5.1 Oversight of climate change issues 5.2 Climate change oversight capability 2% 5.3 Low carbon transition plan 3% 5.4 Climate change management incentives 1% | 3% 3% 4% 1% |
| 5.5 Climate change scenario testing 2% | 0% | |
| Supplier | 6.1 Strategy to influence suppliers to reduce their GHG emissions 6.2 Activities to influence suppliers | 0% 0% |
| Client | 7.1 Strategy to influence client behavior to reduce their GHG emissions 7.2 Activities to influence client behavior to reduce their GHG emissions | 0% 0% |
| Policy Engagement | 8.1 Company policy on engagement with trade associations 8.2 Trade associations supported do not have climate-negative activities or positions 8.3 Position on significant climate policies | 1% 3% 3% |
| Business Model | 9.1 Business activities that drive the energy mix to low carbon 9.2 Business activities that contribute to the reduction of energy demand 9.3 Business activities that develop CCS, CCUS and negative emissions technologies | 0% 0% 0% |

| Metric | Airlines | Auto | Electricity | Oil and Gas | Steel | Cement | Shipping | Food and Agriculture |
|---|---|---|---|---|---|---|---|---|
| Emissions | 0.45 | 0.3 | 0.3 | 0.2 | 0.3 | 0.4 | 0.45 | 0.3 |
| Targets | 0.2 | 0.15 | 0.35 | 0.35 | 0.25 | 0.25 | 0.2 | 0.45 |
| Capital allocation | 0.15 | 0.35 | 0.15 | 0.3 | 0.3 | 0.15 | 0.15 | 0.05 |
| Governance | 0.1 | 0.1 | 0.15 | 0.1 | 0.1 | 0.1 | 0.1 | 0.15 |
| Policy engagement | 0.1 | 0.1 | 0.05 | 0.05 | 0.05 | 0.1 | 0.1 | 0.05 |
5.Aggregation and weighting of submetrics
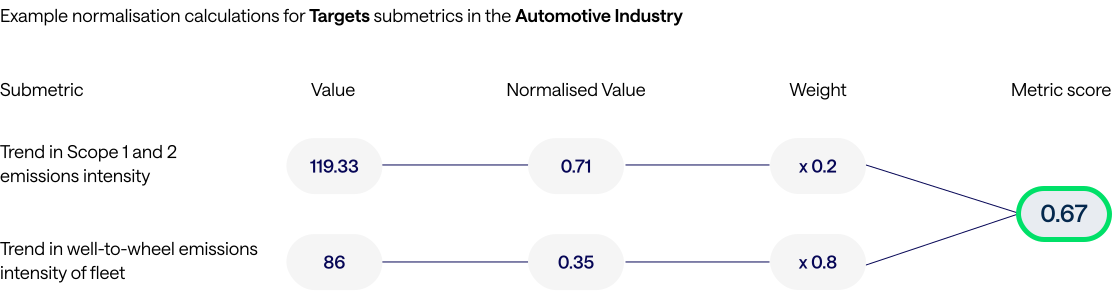
For each of the seven metrics in TransitionArc, the underlying data comprises one or more indicators or sub metrics. These sub metrics are aggregated up into a metric level score (Figure 4).
Similarly to metric weights within the overall grade, the ACT Methodology is used to determine the weighting of metrics within metrics. The weighting for metrics within the seven metrics is determined using the importance of the relevant indicators (or most similar indicators where the source data does not exactly match an indicator in the ACT methodology) relative to one another in the ACT framework. For example, using WBA data, the Emissions metric in the Oil & Gas sector contains two sub metrics for an integrated company (i.e. one that has upstream and downstream operations):
- Trend in past Scope 1+2 emissions intensity
- Trend in past Scope 1+2+3 emissions intensity of sold product performance
These sub metrics correspond to indicators 2.1 and 4.1 in the ACT O&G Methodology which have a weighting of 2% and 5% within the entire ACT Integrated O&G Methodology respectively. Therefore, in this case, as the two sources of data for metric Emissions, they are assigned weightings of 29% and 71% respectively.
Where there is no equivalent ACT Methodology indicator to determine a weighting, the weighting has been decided following discussion with key data providers and partners. The weighting of the TPI powered Emissions and Targets metrics are currently in discussion and may be updated in future.
5.User customization
For both metrics and sub metrics, the platform provides the default weights outlined above. However, users are able to adjust these weights if they wish to assign a different relative importance of metrics for particular use cases (see Section 8 for more detailed explanation). Users should be aware that changing weights will lead to a change in the overall company grade. It is recommended that users use the underlying information and their own preferences to interpret a company’s overall performance.
5.Transparency
A key goal of TransitionArc is to provide transparency back to sources of disclosure and key methodological steps. Within TransitionArc, the underlying data driving the sub metric scores are shown in as granular detail as is currently available. This allows the user to understand the eventual scoring as well as the broader context of the data from which the results have been derived.
At present, this underlying information is available to varying degrees across the different datasets but Arc and our partner data providers are working to improve this over time. For example, previously the underlying information available for ACT Initiative assessments comprised of text summaries for each module (with modules comprising multiple indicators, of which a limited number are used in TransitionArc scoring). WBA have recently released their Heavy Industries Benchmark dataset which is the first benchmarking dataset conducted entirely in-house by WBA. For these heavy industries (including Cement and Steel sectors on TransitionArc), WBA have provided underlying scoring information for every methodological step taken in the analysis for sub metrics driving the Emissions and Targets metrics. This surfacing of key underlying data and methodological decisions is an ongoing process with multiple areas of collaborations and development with key data providers.
* Figures are indicative only. Data and assessments are updated regularly on TransitionArc. Please refer to the live site or API for all available and up-to-date grades, scores, and performance.